
Introduction
For years, engineering leaders have operated under a polite fiction: that we can accurately gauge the health, productivity, and output of our software development teams through a combination of qualitative standup updates, Jira ticket velocity, and raw pull request (PR) counts. We call this the "standup vibe"—a subjective, easily gamed mix of confidence, articulateness, and superficial activity.
With the rapid, widespread adoption of generative AI coding assistants, this fragile consensus has completely shattered. The traditional metrics we relied on are no longer just noisy; they are actively misleading. When an engineer can generate hundreds of lines of boilerplate code with a single tab-complete, measuring lines of code (LOC) or PR velocity becomes worse than useless. It incentivizes the wrong behaviors, bloats codebases, and hides the real bottlenecks in our delivery pipelines.
At the same time, executive leadership is demanding answers. Having invested heavily in AI developer tools, organizations want to see the return on investment (ROI). Are we actually shipping features faster, or are we simply drowning our senior engineers in a deluge of low-quality, AI-generated code reviews?
To solve this, a new category of engineering telemetry is emerging, highlighted by the launch of platforms like Abloomify. The goal is to move past the standup vibe and quantify the actual contribution of human engineers versus their AI assistants. In this article, I will analyze the technical mechanisms behind this shift, explore how we can differentiate human and AI contributions at the code level, and outline a trust-first framework for operationalizing these metrics in your engineering organization.
The Fallacy of the "Standup Vibe" and the AI Productivity Paradox
To understand why we need a new telemetry model, we must first dissect the failure modes of current engineering management practices. The "standup vibe" relies on self-reporting and visibility. In this environment, developers who are highly vocal, write voluminous but low-complexity code, and quickly close simple tickets are often perceived as high performers. Conversely, the quiet, deep-work engineers who tackle complex architectural bottlenecks, refactor fragile modules, or spend days debugging a race condition are frequently undervalued.
Generative AI amplifies this bias exponentially. This is the core of the AI Productivity Paradox: while individual developers report feeling 20% to 50% more productive when using AI assistants, organizational throughput—measured by working features delivered to production—often remains flat or even declines.
There are several technical reasons for this paradox:
- The Review Bottleneck: AI assistants make writing code incredibly cheap, but reviewing code remains expensive. Senior engineers are now spending a disproportionate amount of their time reviewing massive, AI-generated PRs, creating a severe bottleneck at the peer-review stage.
- Code Inflation and Technical Debt: AI tools excel at generating repetitive, verbose code blocks rather than elegant, reusable abstractions. This leads to code inflation, where the codebase grows faster than the underlying business logic, increasing the long-term maintenance burden.
- The "Copy-Paste" Vulnerability: Developers frequently accept AI suggestions without fully understanding the edge cases, introducing subtle security vulnerabilities, architectural mismatches, or performance regressions that are difficult to catch during standard code reviews.
If we continue to measure productivity using legacy metrics like commit frequency, lines of code, or even standard DORA (DevOps Research and Assessment) metrics in isolation, we will optimize for code volume rather than system health. We need to peer inside the development process to understand how code is being written, who (or what) is writing it, and what the long-term impact of that code is on the system architecture.
Deconstructing the Telemetry: How to Differentiate Human and AI Contributions
Quantifying the division of labor between humans and AI requires moving beyond static Git history. A simple git log cannot tell you if a 500-line class was meticulously designed by a principal engineer over eight hours or generated in three seconds by an LLM and pasted into the IDE.
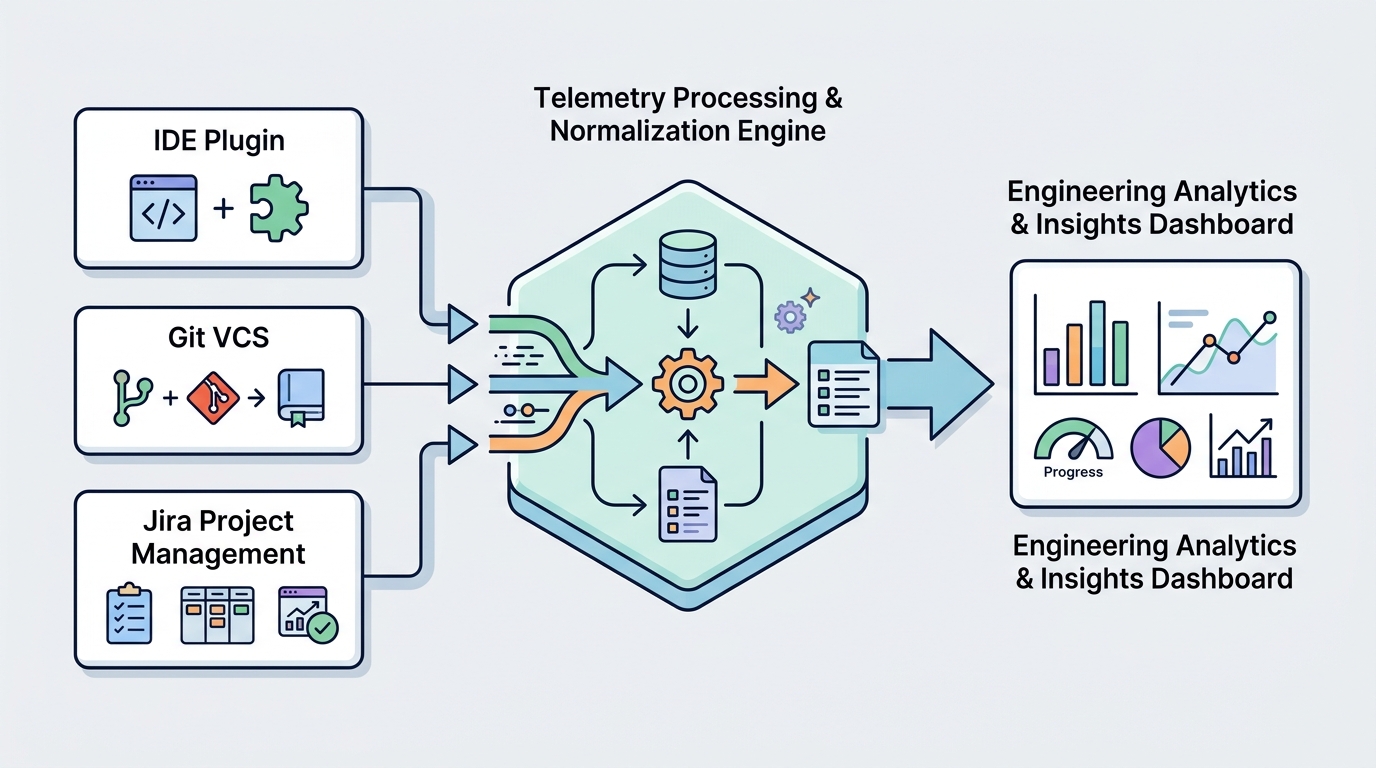
To build an accurate picture of engineering contribution, we must correlate multiple streams of telemetry across three distinct layers: the IDE, the Version Control System (VCS), and the Project Management tool.
1. IDE-Level Telemetry (The Ingestion Layer)
The most granular data originates within the developer's workspace. Modern engineering telemetry platforms utilize lightweight IDE plugins to capture interaction events. This is not about keystroke logging (which is invasive and counterproductive), but rather capturing structural patterns of code creation:
- Paste-Buffer Telemetry: Monitoring the volume and frequency of code blocks inserted via paste actions versus manual typing. A sudden insertion of 150 syntactically complete lines within a single millisecond is a clear indicator of external generation (either from an AI tool, StackOverflow, or internal code reuse).
- Suggestion Acceptance Rates: Tracking how many AI-generated inline suggestions are accepted, rejected, or partially edited by the developer. This provides a direct measure of how much the AI is contributing to the active drafting of the code.
- Active Editing Time: Measuring the dwell time on specific lines of code. If a developer accepts a 50-line AI suggestion and immediately moves to another file, the cognitive investment in those 50 lines is low. If they spend ten minutes refactoring, renaming variables, and adding assertions to that suggestion, the human contribution is significantly higher.
2. Git and AST-Level Analysis (The Structural Layer)
Once code is committed and pushed, we can analyze the structural characteristics of the changes using Abstract Syntax Tree (AST) parsing and statistical analysis of the Git diffs.
- Code Entropy and Complexity: AI-generated code often exhibits lower structural entropy. It tends to follow highly predictable, idiomatic patterns found in its training data. By parsing the AST of the modified files, we can evaluate whether the new code introduces unique structural logic or repeats existing patterns.
- Churn and Refactoring Ratios: We must track how quickly newly written code is modified or deleted. A high "code churn" rate within 14 days of creation often indicates that low-quality AI suggestions were accepted and subsequently had to be rewritten or patched by human engineers.
- Granular Attribution Mapping: By combining IDE telemetry with Git blame data, we can map every line of code in a PR to a specific contribution profile (e.g., "80% AI-generated, 20% human-edited").
3. Jira and Work Item Alignment (The Contextual Layer)
Code metrics are meaningless without business context. We must map code changes back to our project management tools (like Jira or Linear) to understand the intent behind the work.
- Complexity-to-Value Mapping: Is the AI being used to automate low-risk, repetitive tasks (like writing unit tests, boilerplate data transfer objects, or API clients), or is it being used in highly complex, core business domains?
- Cycle Time Decomposition: Breaking down the time a work item spends in various states (In Progress, In Review, QA, Done). If "In Progress" time drops significantly due to AI generation, but "In Review" or "QA" times double, the telemetry must surface this imbalance so engineering leaders can adjust their processes.
Designing a Trust-First Engineering Metrics Framework
Whenever we introduce metrics that track individual developer behavior, we risk creating a toxic culture of surveillance. If developers believe that telemetry tools are being used as a "digital panopticon" to micromanage their time or rank them against their peers, they will quickly find ways to game the system. They will write scripts to simulate IDE activity, accept AI suggestions just to boost their metrics, or refuse to tackle difficult, ambiguous tasks that don't translate well to telemetry dashboards.
To avoid this, I recommend implementing a Trust-First Engineering Metrics Framework. This framework is built on three core pillars: developer agency, aggregated insights, and a focus on systemic bottlenecks over individual performance.
| Pillar | Core Principle | Tactical Implementation |
|---|---|---|
| Developer Agency | Telemetry should be a tool for the developer, not just the manager. | Give developers access to their own telemetry dashboards first. Allow them to see how they use AI, where their time goes, and use that data for self-improvement before it is rolled up to team-level views. |
| Aggregated Insights | Individual metrics should never be used for performance reviews or stack ranking. | Aggregate telemetry at the team, department, or repository level. Focus on trends (e.g., "Our team's PR review time has increased by 30% since adopting AI tool X") rather than individual output. |
| Systemic Focus | Use data to identify process bottlenecks, not human failures. | Use telemetry to answer structural questions: Is our CI/CD pipeline too slow? Are our PRs too large? Is our architectural complexity preventing developers from shipping code efficiently? |
When you present telemetry as a way to advocate for the engineering team—for example, using data to show executive leadership that the team is burning out on code reviews and needs more headcount, or that legacy technical debt is slowing down feature delivery—you build trust. Developers will embrace the telemetry because it validates their daily reality, rather than penalizing them for it.
Operationalizing Telemetry: Integration, Noise Reduction, and Actionable Dashboards
To implement this telemetry pipeline practically, you need to ingest data from your IDEs, VCS, and project management tools, normalize it, and filter out the noise. Let's look at how we can structure a telemetry ingestion schema to process these events.
The following JSON schema represents a standardized payload for a code contribution event, capturing both the human interaction metrics and the AI assistance context. This is the type of data that an IDE plugin would emit to your telemetry processing pipeline:
{
  "$schema": "https://json-schema.org/draft/2020-12/schema",
  "title": "CodeContributionEvent",
  "type": "object",
  "required": [
    "eventId",
    "timestamp",
    "developerId",
    "repository",
    "fileContext",
    "contributionMetrics"
  ],
  "properties": {
    "eventId": {
      "type": "string",
      "format": "uuid"
    },
    "timestamp": {
      "type": "string",
      "format": "date-time"
    },
    "developerId": {
      "type": "string"
    },
    "repository": {
      "type": "string"
    },
    "fileContext": {
      "type": "object",
      "required": ["filePath", "language"],
      "properties": {
        "filePath": { "type": "string" },
        "language": { "type": "string" }
      }
    },
    "contributionMetrics": {
      "type": "object",
      "required": [
        "totalLinesAdded",
        "pasteBufferLines",
        "aiSuggestionsAccepted",
        "activeEditingSeconds",
        "astComplexityDelta"
      ],
      "properties": {
        "totalLinesAdded": { "type": "integer", "minimum": 0 },
        "pasteBufferLines": { "type": "integer", "minimum": 0 },
        "aiSuggestionsAccepted": { "type": "integer", "minimum": 0 },
        "activeEditingSeconds": { "type": "integer", "minimum": 0 },
        "astComplexityDelta": { "type": "number" }
      }
    }
  }
}
Once you have established a pipeline to collect this data, you must apply specific filters to reduce noise and ensure accuracy:
- Filter Out Generated Files: Exclude dependency lockfiles (
package-lock.json,Cargo.lock), compiled assets, and auto-generated code (e.g., OpenAPI schemas, Protobuf files) from your telemetry. Including these will heavily skew your metrics, making it look like your team is writing millions of lines of code when they are simply running build scripts. - Establish a Baseline for "Human Typing Speed": Set statistical thresholds to differentiate manual typing from automated insertion. If a developer adds 500 characters in under two seconds without a paste event, flag this as an external contribution. This helps catch un-instrumented AI tools or external copy-pasting.
- Normalize by Language and Domain: Writing 100 lines of Rust or C++ typically requires significantly more cognitive effort and time than writing 100 lines of HTML or CSS. Your telemetry platform must weight contributions based on the language, framework, and complexity of the target file.
With clean, normalized data, you can build actionable dashboards that answer critical operational questions for engineering leaders:
- The AI Leverage Index: What percentage of our shipped codebase is generated by AI versus written by humans? Is this ratio stable, or are we becoming overly reliant on AI-generated code in core business modules?
- The Review-to-Author Ratio: How much time do senior developers spend reviewing PRs relative to the time authors spend writing them? If this ratio is climbing, it indicates that we are shipping low-quality code that requires excessive oversight.
- The Code Longevity Metric: What percentage of AI-assisted code survives in production for more than 30 days without being modified or deleted? This is a direct measure of the quality and stability of our AI-assisted output.
Conclusion
The launch of platforms like Abloomify represents a necessary evolution in engineering management. The era of managing by the "standup vibe" is over. As generative AI continues to reshape the software development landscape, we can no longer afford to rely on subjective updates or simplistic, volume-based metrics to measure productivity.
By implementing a multi-layered telemetry framework that correlates IDE interactions, Git history, and work items, we can finally quantify the true contribution of both our human engineers and our AI assistants. This is not about micromanaging developers; it is about gaining the visibility needed to optimize our delivery pipelines, reduce technical debt, and ensure the long-term health of our software systems.
My recommendation for engineering leaders is to start small. Begin by instrumenting your repositories to track basic metrics like code churn and PR cycle times. Involve your developers in the process, explain the goals of the telemetry, and ensure that the data is used to improve processes rather than evaluate individuals. By building a foundation of trust and data-driven visibility, you can successfully navigate the transition to AI-assisted engineering and build a more resilient, high-performing organization.