

The Architecture of OpenTelemetry: API, SDK, and Collector
To successfully implement OpenTelemetry, you must first understand the strict separation of concerns between its primary components: the API, the SDK, and the Collector. This decoupling is the core design pattern that protects your application code from changes in both telemetry implementation and backend destinations.
The API (Application Programming Interface)
The API is the dependency you add directly to your application code. It defines the programming model, data types, and interfaces for capturing traces, metrics, and logs. Crucially, the API contains no operational logic. It is a set of abstract interfaces that return no-op (no-operation) implementations by default.
This design ensures that if you instrument your application with the OTel API but do not configure an SDK, your application will run without throwing exceptions or incurring performance overhead. It completely decouples your business logic from the telemetry implementation, allowing developers to instrument code without worrying about how or where that data is sent.
The SDK (Software Development Kit)
The SDK is the concrete implementation of the API. It manages the state, in-memory buffering, sampling, processing, and exporting of telemetry data. You configure the SDK at application startup (typically via dependency injection or initialization scripts) and pair it with exporters to ship data either directly to a backend or, preferably, to an intermediate collector.
Because the SDK handles heavy operational tasks like batching, context propagation, and network communication, its configuration directly impacts your application's resource consumption. Misconfiguring SDK parameters, such as buffer sizes or sampling ratios, can lead to memory exhaustion or CPU spikes under high-throughput conditions.
The Collector
The OpenTelemetry Collector is a high-performance, proxy-like service that runs independently of your applications. It acts as a centralized telemetry pipeline, capable of receiving, processing, and exporting telemetry data across multiple formats (including OTLP, Jaeger, Zipkin, and Prometheus).
Deploying the Collector allows you to offload processing overhead from your application processes. Instead of each microservice instance managing multiple connections and serialization tasks for different backends, they ship raw OTLP (OpenTelemetry Protocol) data over gRPC or HTTP/2 to a local or centralized Collector. The Collector then handles batching, filtering, PII masking, and multi-destination routing.
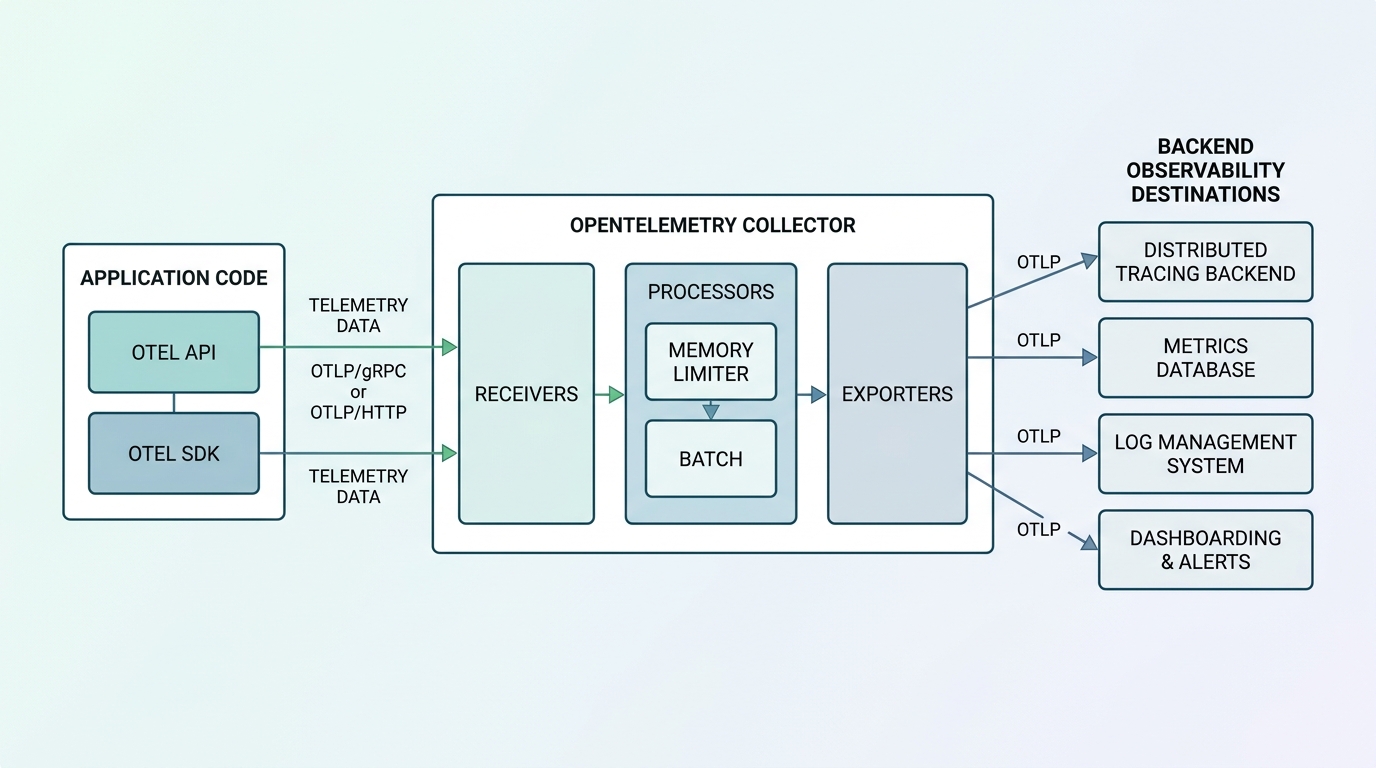
This architecture establishes a clear boundary between your application's execution space and your telemetry routing infrastructure. By standardizing on OTLP as the internal wire protocol, you gain the flexibility to swap, split, or duplicate backend observability platforms purely by modifying the Collector's configuration, without touching a single line of application code.
Implementing the Collector: Configuration, Pipelines, and Processing
The OpenTelemetry Collector is configured via a single YAML file that defines its pipelines. A pipeline is a directed acyclic graph (DAG) composed of four distinct components:
- Receivers: Define how data enters the Collector (push or pull, protocol, port).
- Processors: Perform operations on the data (batching, memory limiting, attribute manipulation, sampling).
- Exporters: Define where the processed data is sent (OLTP endpoints, vendor backends, local files).
- Connectors: Link different pipelines together, allowing you to route data from one pipeline (e.g., traces) into another (e.g., metrics derived from spans).
To run a stable, production-grade Collector, you must configure processors in a specific order. Specifically, the memory_limiter processor must always be placed as early as possible in the pipeline to prevent out-of-memory (OOM) crashes, followed by the batch processor to optimize network throughput and compression.
Below is a highly robust, production-ready Collector configuration demonstrating these principles, including secure OTLP ingestion, memory safeguards, and multi-backend routing:
receivers:
  otlp:
    protocols:
      grpc:
        endpoint: 0.0.0.0:4317
      http:
        endpoint: 0.0.0.0:4318

processors:
  memory_limiter:
    check_interval: 1s
    limit_percentage: 80
    spike_limit_percentage: 20

  batch:
    send_batch_size: 8192
    timeout: 1s
    send_batch_max_size: 10240

  resourcedetection:
    detectors: [env, gcp, ecs, ec2]
    timeout: 2s
    override: false

  transform:
    error_mode: ignore
    trace_statements:
      - context: span
        statements:
          - replace_all_patterns(attributes, "value", "password", "[REDACTED]")
          - replace_all_patterns(attributes, "value", "token", "[REDACTED]")

exporters:
  otlp/primary:
    endpoint: api.observability-vendor.com:443
    headers:
      api-key: ${env:OBS_API_KEY}

  otlp/secondary:
    endpoint: backup-collector.internal.net:4317
    tls:
      insecure: true

service:
  pipelines:
    traces:
      receivers: [otlp]
      processors: [memory_limiter, resourcedetection, transform, batch]
      exporters: [otlp/primary, otlp/secondary]
    metrics:
      receivers: [otlp]
      processors: [memory_limiter, batch]
      exporters: [otlp/primary]
  telemetry:
    logs:
      level: "info"
    metrics:
      address: "0.0.0.0:8888"
Key Processor Mechanisms
memory_limiter: This processor acts as a circuit breaker. It monitors the Collector's heap usage. If memory consumption exceeds 80% (as configured above), it begins dropping data and returning errors to the receivers, forcing upstream clients to retry. This prevents the Collector from being killed by the OS kernel under sudden traffic surges.batch: Batching is critical for both network efficiency and backend ingestion limits. The configuration above ensures that spans and metrics are grouped into batches of up to 10,240 items, or flushed every 1 second, whichever comes first. This drastically reduces HTTP/gRPC request overhead.transform: This processor uses the OpenTelemetry Transformation Language (OTTL) to inspect and modify telemetry on the fly. In the example, I have configured it to scan span attributes and redact sensitive keys likepasswordandtokenbefore the data leaves your network boundary.
Architectural Trade-offs: Agent vs. Gateway, Memory, and Performance
When designing your OpenTelemetry deployment topology, you must make a fundamental architectural decision: should you deploy the Collector as an Agent (sidecar/daemonset) or as a Gateway (standalone cluster)?
In my experience, the optimal pattern is a hybrid approach, but you must understand the trade-offs of each model to make an informed decision for your specific infrastructure.
| Architectural Dimension | Agent Pattern (Sidecar / DaemonSet) | Gateway Pattern (Standalone Cluster) |
|---|---|---|
| Deployment Location | Runs alongside the application (same VM or pod) | Runs as a dedicated service layer behind a load balancer |
| Resource Overhead | High aggregate overhead (many small instances) | Low aggregate overhead (fewer, highly utilized instances) |
| Network Latency | Near-zero local loopback latency (localhost) | Minor network hop latency over internal network |
| Security Boundary | Handles local decryption and initial filtering | Centralized place to manage egress keys and global PII scrubbing |
| Failure Domain | Isolated. A crash only affects the local host/pod | Shared. A gateway outage can drop telemetry for the entire cluster |
| Backpressure Management | Excellent. Can buffer locally to disk or memory | Complex. Requires upstream agents to buffer during gateway saturation |
The Hybrid Pattern: Recommended Practice
For enterprise-grade deployments, I recommend a tiered architecture. Deploy the Collector as an Agent on every node (or as a sidecar in serverless environments like AWS Fargate). The application SDKs connect to this local Agent over localhost via gRPC.
This local Agent performs lightweight tasks: it receives the data, adds node-level metadata (such as Kubernetes pod names or cloud provider instance IDs using the resourcedetection processor), and immediately forwards it to a centralized pool of Gateways.
The Gateway pool, managed by an autoscaling group or Kubernetes Horizontal Pod Autoscaler (HPA), handles the heavy lifting: global rate limiting, complex OTTL transformations, log parsing, and routing to multiple external backends. This hybrid model isolates your application from network failures, minimizes application-side CPU usage, and centralizes security and egress configurations.
Memory and Performance Tuning
To prevent the Collector from becoming a bottleneck, you must tune its runtime environment. The Collector is written in Go, which means it is subject to garbage collection (GC) pauses and memory overhead.
I advise setting the GOGC environment variable to a lower value (e.g., GOGC=80 or GOGC=50) on your Gateway instances if they experience high memory churn. This forces the Go runtime to collect garbage more aggressively, keeping the memory footprint stable at the expense of a negligible increase in CPU usage. Additionally, always set explicit CPU and memory limits in your container orchestrator that align with your memory_limiter processor thresholds.
Migration Strategies: Moving from Proprietary APM to OpenTelemetry
Transitioning an enterprise from legacy, proprietary APM agents to OpenTelemetry is an operational challenge that requires a phased, risk-mitigated approach. You cannot simply rewrite every application and swap agents overnight.
I recommend a four-phase migration framework designed to maintain continuous visibility while systematically replacing legacy components.
Phase 1: The Dual-Receiver Collector Deployment
Do not start by changing your application code. Instead, deploy the OpenTelemetry Collector as a gateway in your infrastructure. Configure the Collector to receive both standard OTLP data and legacy formats (many proprietary vendors offer OTel-compatible receivers or APIs, and OTel itself has receivers for Zipkin, Jaeger, and Prometheus metrics).
Configure the Collector to export data directly to your existing proprietary APM backend. This establishes your data pipeline control plane without altering your application runtime environments.
Phase 2: Auto-Instrumentation and the Zero-Code Approach
To gain immediate momentum, leverage OpenTelemetry's auto-instrumentation capabilities. OTel provides language-specific agents and operators (such as the OpenTelemetry Kubernetes Operator) that dynamically inject instrumentation into your application runtimes at startup without requiring code changes.
For example, in Java, Node.js, or Python, you can attach the OTel agent jar/agent module via container environment variables. This will immediately begin emitting standard HTTP, database, and gRPC spans. Direct these auto-instrumented agents to send their data to the Collector gateway established in Phase 1.
Phase 3: Targeted Manual Instrumentation
Auto-instrumentation provides excellent horizontal coverage (system boundaries, network calls, database queries), but it lacks business context. Once your auto-instrumentation pipeline is stable, task your development teams with adding manual instrumentation using the OpenTelemetry API.
Focus manual instrumentation on high-value areas:
- Capturing domain-specific business metrics (e.g., checkout values, active user sessions).
- Adding custom span attributes (e.g.,
tenant.id,order.type) to assist in high-cardinality debugging. - Creating explicit spans around complex, CPU-intensive internal algorithms that network-level auto-instrumentation cannot see.
Phase 4: Backend Decoupling and Vendor Evaluation
With your application code now emitting standardized OTLP data to your Collector gateway, you have achieved complete vendor independence.
If you decide to evaluate a new observability vendor or adopt an open-source backend like Jaeger or Grafana Mimir, you do not need to ask your developers to modify their code or redeploy their services. You simply update the exporters and pipelines blocks in your Collector YAML configuration, apply the change, and stream your telemetry to the new destination in parallel with the old one. Once validated, you can safely decommission the legacy backend.
Conclusion
The CNCF graduation of OpenTelemetry is a clear signal that the era of proprietary telemetry collection has ended. By decoupling the instrumentation API from the operational SDK and introducing the highly configurable Collector, OpenTelemetry has provided engineering teams with unprecedented control over their observability data, performance overhead, and vendor relationships.
To capitalize on this standard, I recommend taking three immediate actions:
- Standardize on OTLP: Mandate that all new internal services use the OpenTelemetry API and SDK for tracing and metrics.
- Deploy a Collector Gateway: Establish a centralized, highly available Collector cluster using the memory safeguards and batching configurations outlined above.
- Initiate Auto-Instrumentation: Implement the OTel Kubernetes Operator or language-specific runtime agents to instantly gain baseline visibility across your legacy applications without requiring immediate code rewrites.
By taking these steps, you will build a resilient, future-proof observability architecture that scales with your infrastructure and protects your organization from vendor lock-in.